
Solutions
© 2025 Discover.Market, LLC
Solutions
© 2025 Discover.Market, LLC
© 2025 Discover.Market, LLC
Know what pays. Double down on it.
Your analytics tie Market activity to real revenue—live feed, product popularity, regional heat, and rep
territory performance.
Pipeline created
$847K
Quotes & order intents from tracked activity
Time to first order
18 days
From first interaction to first purchase
Repeat order rate
68%
% of accounts placing 2+ orders

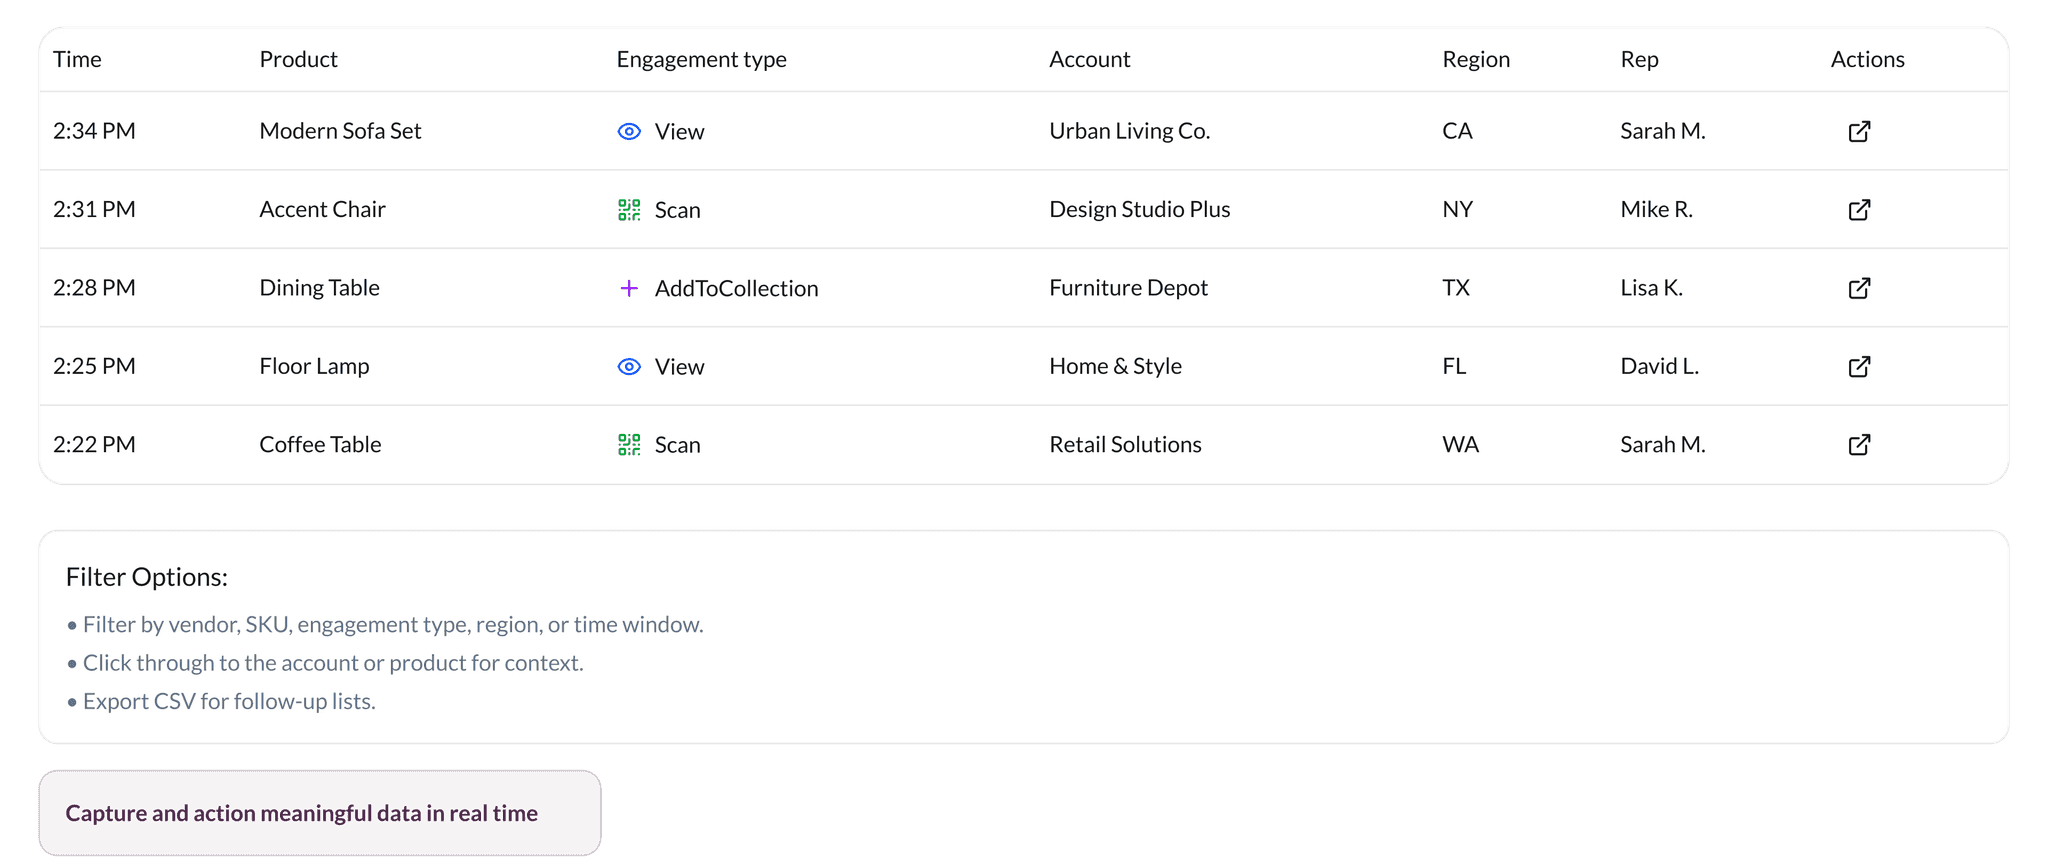
Live activity feed
Every interaction in one stream: product views, QR scans, and "add to collection" events across all end-users.
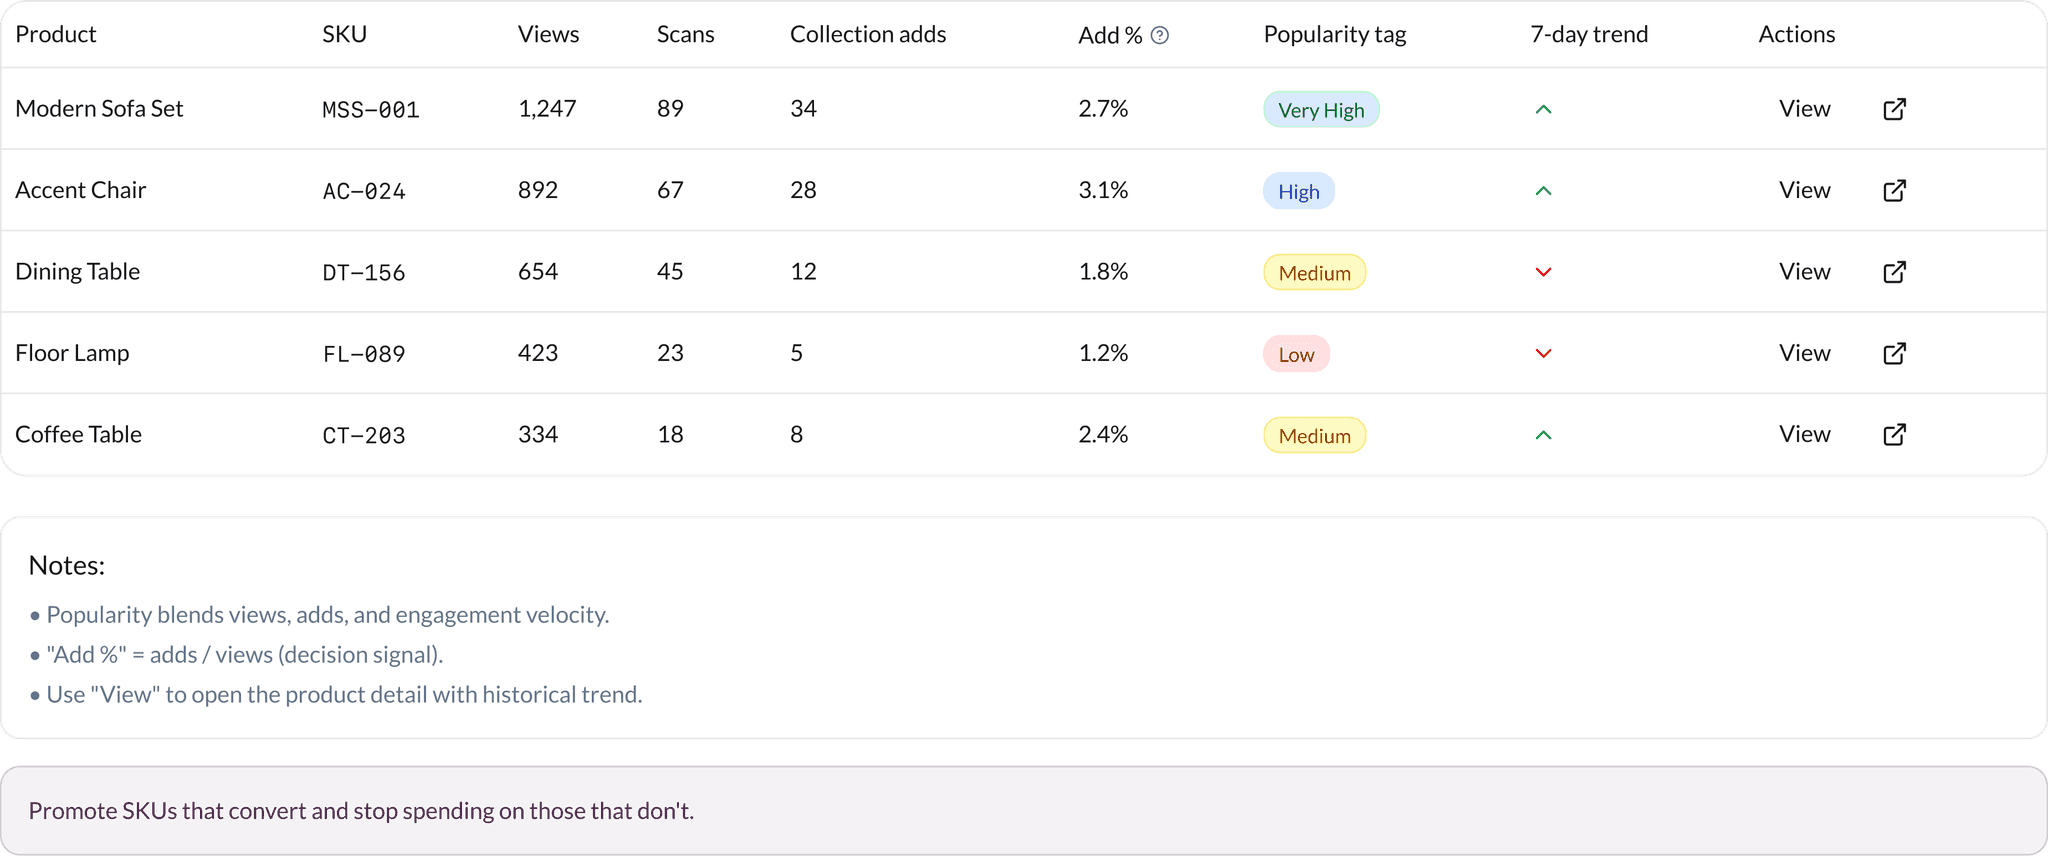
Product popularity
Ranked SKUs with trends so you can push winners and fix—or drop—laggards.
Meeting conversion
34%
Appointments that turn into opportunities
Live activity feed
Every interaction in one stream: product views, QR scans, and "add to collection" events across all end-users.
Product popularity
Ranked SKUs with trends so you can push winners and fix—or drop—laggards.
Regional engagement
See where demand is building—state and territory heat with top regions ranked.
Engagement Heat Map
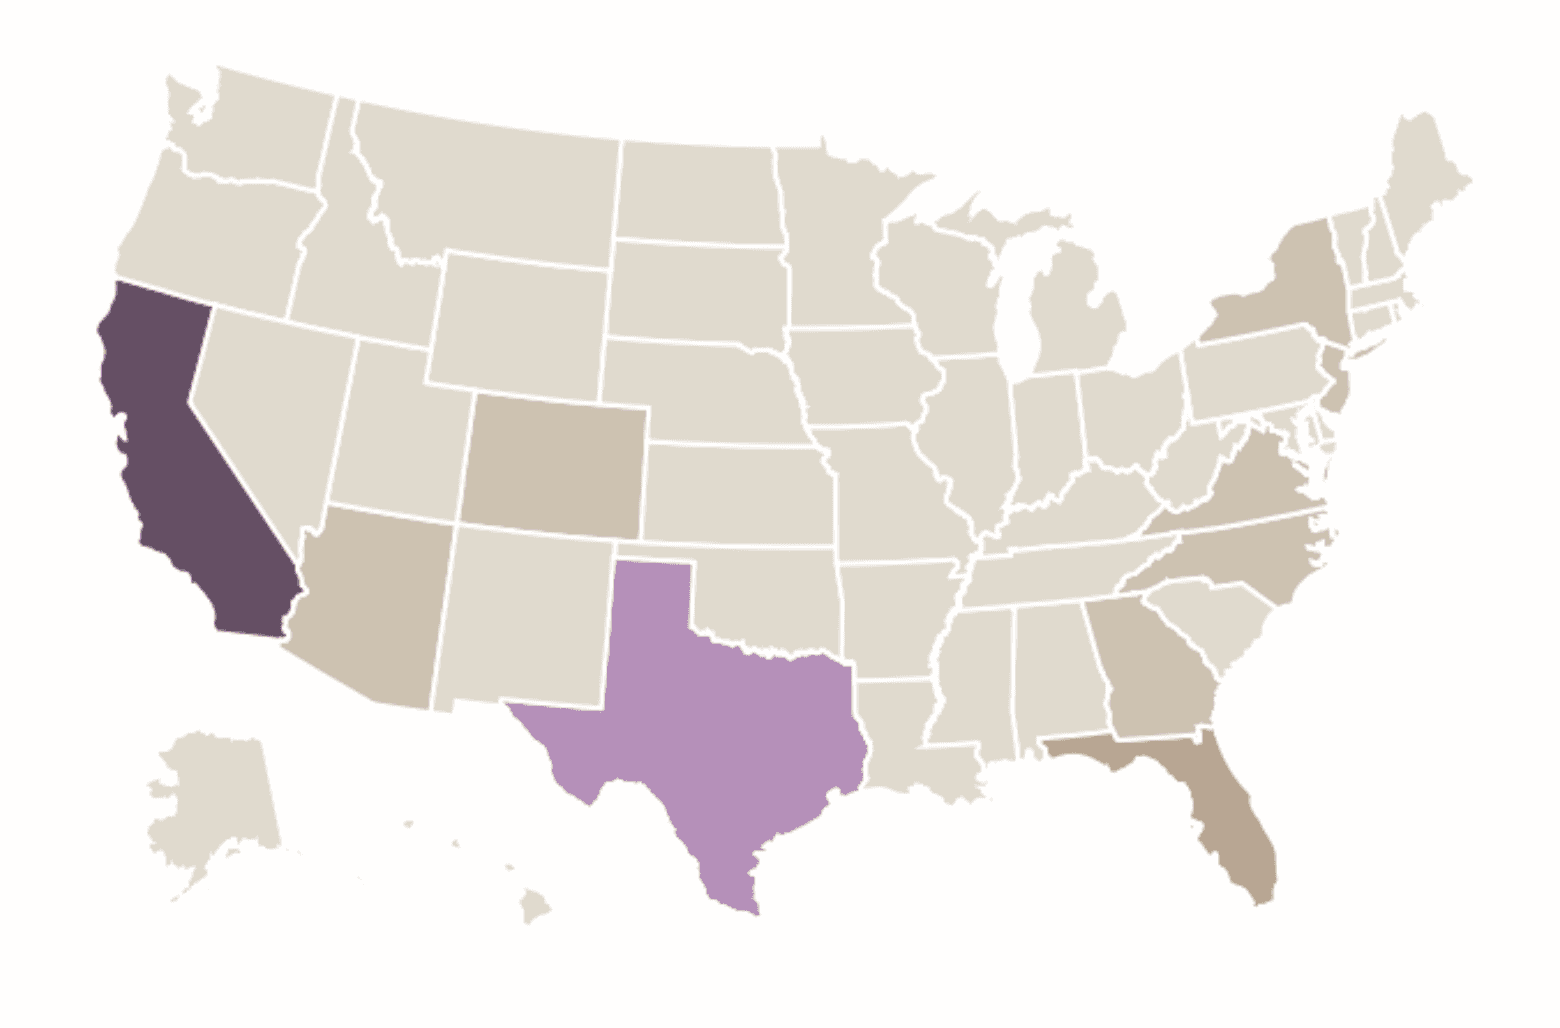
Higher engagement
Lower engagement
Top Regions
Region
Views
Scans
Collection adds
Total
interactions
California
2,847
234
89
3,170
New York
2,156
198
67
2,421
Texas
1,932
167
54
2,153
Florida
1,654
134
43
1,831
Virginia
1,432
123
38
1,593
Pennsylvania
1,232
103
28
1,363
Colorado
1,114
59
58
1,231
Arizona
1,109
50
38
1,197
Callout: Compare date ranges to see Market week spikes vs. baseline.
ROI: Aim appointments, inventory, and rep time where buyers are actually active.
Rep & territory performance
Who's creating pipeline—and where to coach.
By territory
By rep
Territory
Views
Scans
Collection adds
Total interactions
Meetings
Opportunities
Win rate
Actions
West Coast
4,279
357
127
4,763
23
12
52%
Northeast
3,421
287
98
3,806
19
14
74%
Southeast
2,876
234
76
3,186
16
8
50%
Midwest
2,134
178
54
2,366
12
9
75%
ROI: Route hot accounts to top performers and coach the rest to lift close rates.
More ways to get paid
More ways to get paid
Market vs. year-round
Compare Market week spikes with always-on sourcing.
Prove pipeline outside show dates by exhibiting to buyers year-round.
Exports & schedules
Email/PDF snapshots and CSV exports.
Fewer manual reports; more time selling.
Accounts overview
Top accounts by interaction and repeat behavior.
Focus on buyers with the highest probability to order again.
Attribution & UTM integrity
See which sources and campaigns actually convert.
Cut dead channels; defend spend that drives orders.
Schedule Email
Export CSV
Ready to turn these insights into orders?
Book demo
Get vendor kit
Ready to turn these insights into orders?
Book demo
Get vendor kit
Know what pays. Double down on it.
Your analytics tie Market activity to real revenue—live feed, product popularity, regional heat, and rep
territory performance.
ROI banner: Insights exist to pay for the subscription—cut what doesn't convert and scale what does.
Cut what doesn't convert and scale what does.
Rep & territory performance
Who's creating pipeline—and where to coach.
By territory
By rep
Territory
Views
Scans
Collection adds
Total interactions
Meetings
Opportunities
Win rate
Actions
West Coast
4,279
357
127
4,763
23
12
52%
Northeast
3,421
287
98
3,806
19
14
74%
Southeast
2,876
234
76
3,186
16
8
50%
Midwest
2,134
178
54
2,366
12
9
75%
Route hot accounts to top performers and coach the rest to lift close rates.
More ways to get paid
Market vs. year-round
Compare Market week spikes with always-on sourcing.
Prove pipeline outside show dates by exhibiting to buyers year-round.
Exports & schedules
Email/PDF snapshots and CSV exports.
Fewer manual reports; more time selling.
Accounts overview
Top accounts by interaction and repeat behavior.
Focus on buyers with the highest probability to order again.
Attribution & UTM integrity
See which sources and campaigns actually convert.
Cut dead channels; defend spend that drives orders.
Schedule Email
Export CSV
Ready to turn these insights into orders?
Book demo
Get vendor kit